


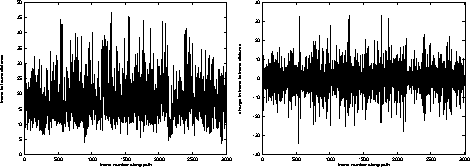


We add 75 dpi images to the movie, and use a resolution of 37 dpi when creating our distance matrix. Figures 4 , 5 and 6 visualize our results using the various methods with a threshold 0 (all images become index frames), and the trigram based distance matrix as described above.
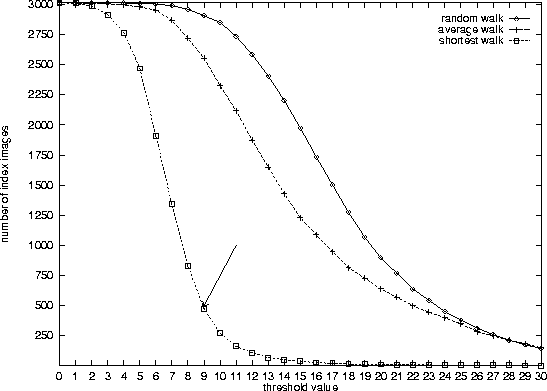
From these figures it is clear that the shortest walk method produces the best results. The distances along the path generated and difference in distances are small, in comparison with the other two methods.Whereas the average change in distance between subsequent frames in the random walk was about 18, the average walk reduces this to 15.5 and the shortest walk to 6.8 (38 percent); a considerable reduction. Only at the end of the walk the variance starts to increase. As expected, the random walk produces a random set of distances. The average walk nicely describes the meaning of sorted on row average because the fluctuation of the distance values increases steadily. From these results we can imagine that, when using a threshold value greater than zero, the best results should be achieved when using the shortest walk. The shortest walk should produce the largest clusters of similar images, thus producing the best overview of the LCPD image database. We represent the results in figure 7 . As we concluded that the shortest walk is the best method to use, the following results are based on this method. A critical point is the choice of a threshold value for clustering. This value decides how many frames the index loop will get and how many and how long each cluster loop will be. To obtain a good overview, we use the threshold value which is determined from the threshold where the greatest reduction in the shortest walk has taken place while the reduction of the random walk is still quite small. From figure 7 a threshold value between 8 and 9 is suggested. Our generated shortest distance movie with threshold 9 had about 500 frames. When reviewing these generated video loops, we found that front and back sides of the images mostly appeared in separate clusters; that some clusters contain many like images (for instance the cluster with empty back-sides) and that there are a considerable number of single frames i.e. index frames that have no cluster associated with them because their content differs to much from the rest of the database.
Dr. D.P. Huijsmans