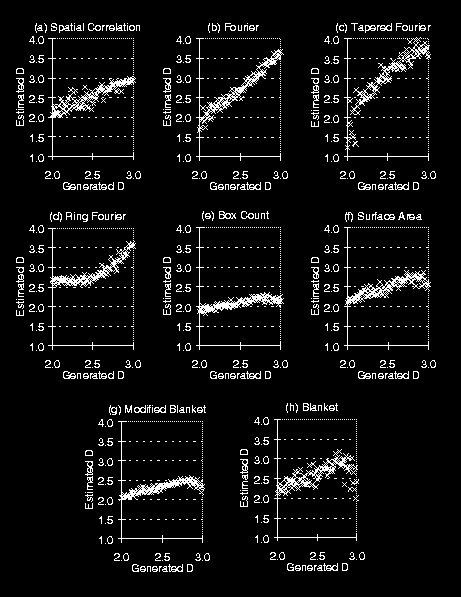


Generated and estimated fractal dimensions are compared in fig. 1, and the corresponding correlation coefficients are given in table 1.
Figure 1: A comparison of 8 methods (a-h) for the estimation of fractal dimension (D). Each plot compares the estimated D with generated D where a given method has been applied to 101 samples of 25x25 textures generated with fractal dimensions 2.00, 2.01, 2.02 ... 3.00.
| r r | r p | |
|---|---|---|
| Sparial Correlation | 0.890 | 0.891 |
| Fourier | 0.980 | 0.982 |
| Tapered Fourier | 0.919 | 0.958 |
| Ring Fourier | 0.868 | 0.873 |
| Box Count | 0.837 | 0.835 |
| Surface Area | 0.860 | 0.858 |
| Modified Blanket | 0.834 | 0.836 |
| Blanket | 0.618 | 0.632 |
Similarly, the correlation coefficients for the self-similar estimation methods applied to the samples with re-scaled intensity range are shown in table 2.
| r r | r p | |
|---|---|---|
| Box Count | 0.000 | 0.000 |
| Surface Area | 0.860 | 0.858 |
| Modified Blanket | 0.755 | 0.769 |


